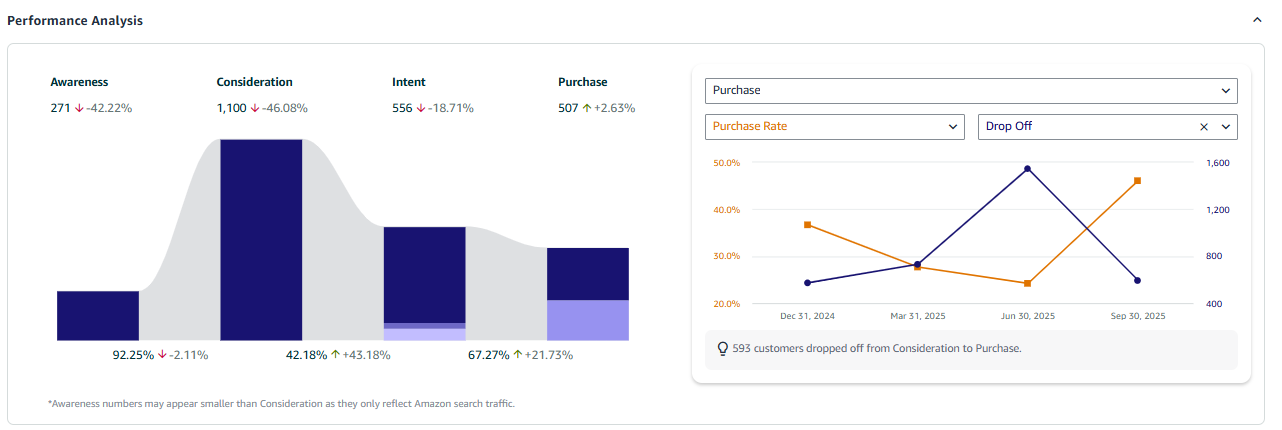
Amazon’s Customer Journey Analytics ( available in the US ) provides product-level insights, making it similar to Google Analytics.
We can now see
– add-to-cart rate
– Purchase rate
– Impressions
– Clicks
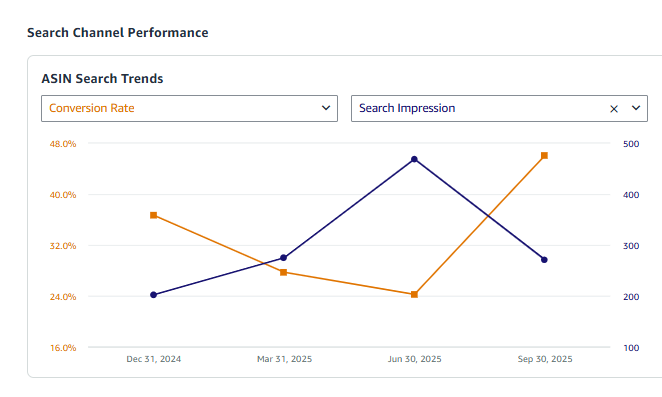
– Search trends
– And much more explained below:
One of the most interesting metrics in this block is new customers, as this is our main goal for this quarter. Unfortunately, this metric is in decline.
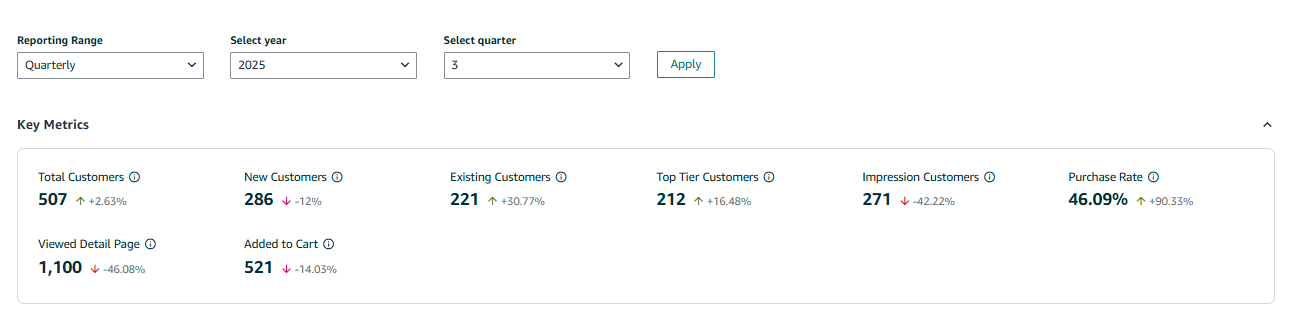
It’s good to see an increased purchase rate, which proves that the traffic visiting this page is more targeted and relevant.
The search impression is down, which is obviously a cause for concern. As a result, more effort will need to be put into driving traffic.
Demographics can help you to create appealing visuals for your pages, such as infographics, A+ pages and product videos.
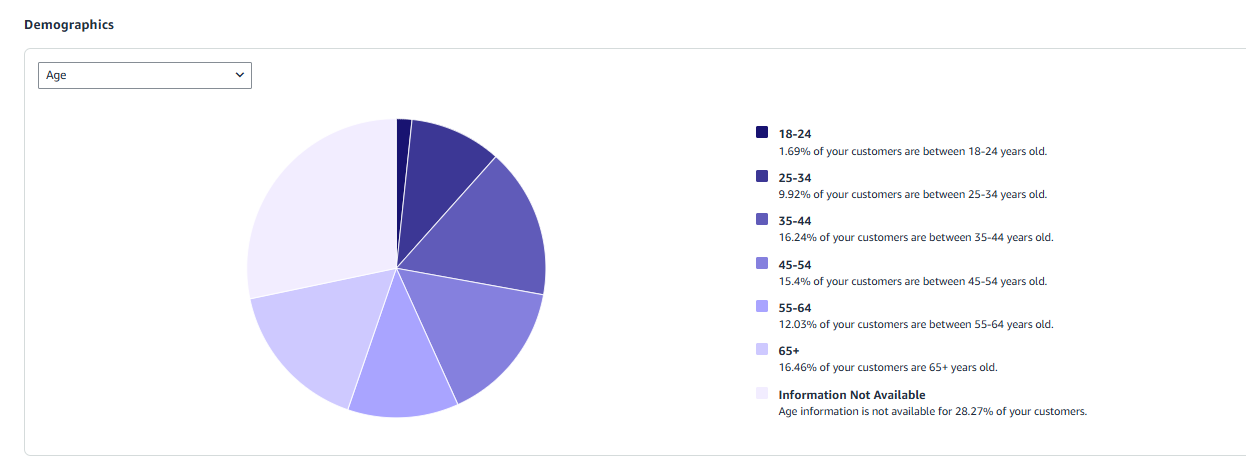
The best part is the recommendation to improve conversion rates by offering brand-tailored discount promotions.